Web application for a dispatching company focusing on user communication.
Project Overview
During this Internship, I collaborated with the clients and software developers to design high-fidelity prototypes in Figma for a web application that monitors cars, drivers, and deliveries for dispatching companies.
What I did
UX/UI Design
Interaction Design
Data Visualization
Timeline
September 2021 - March 2022
7 Months
Project Brief
For this project, I was asked to design an entire web application that would be used by Delivery Service Providers (DSP) to supervise drivers and to track the quality of their work. During these 7 months, I met with my client-facing supervisor every day to discuss daily iterations and to assess our design choices. Check out some of the many designs I created and the decisions behind them.
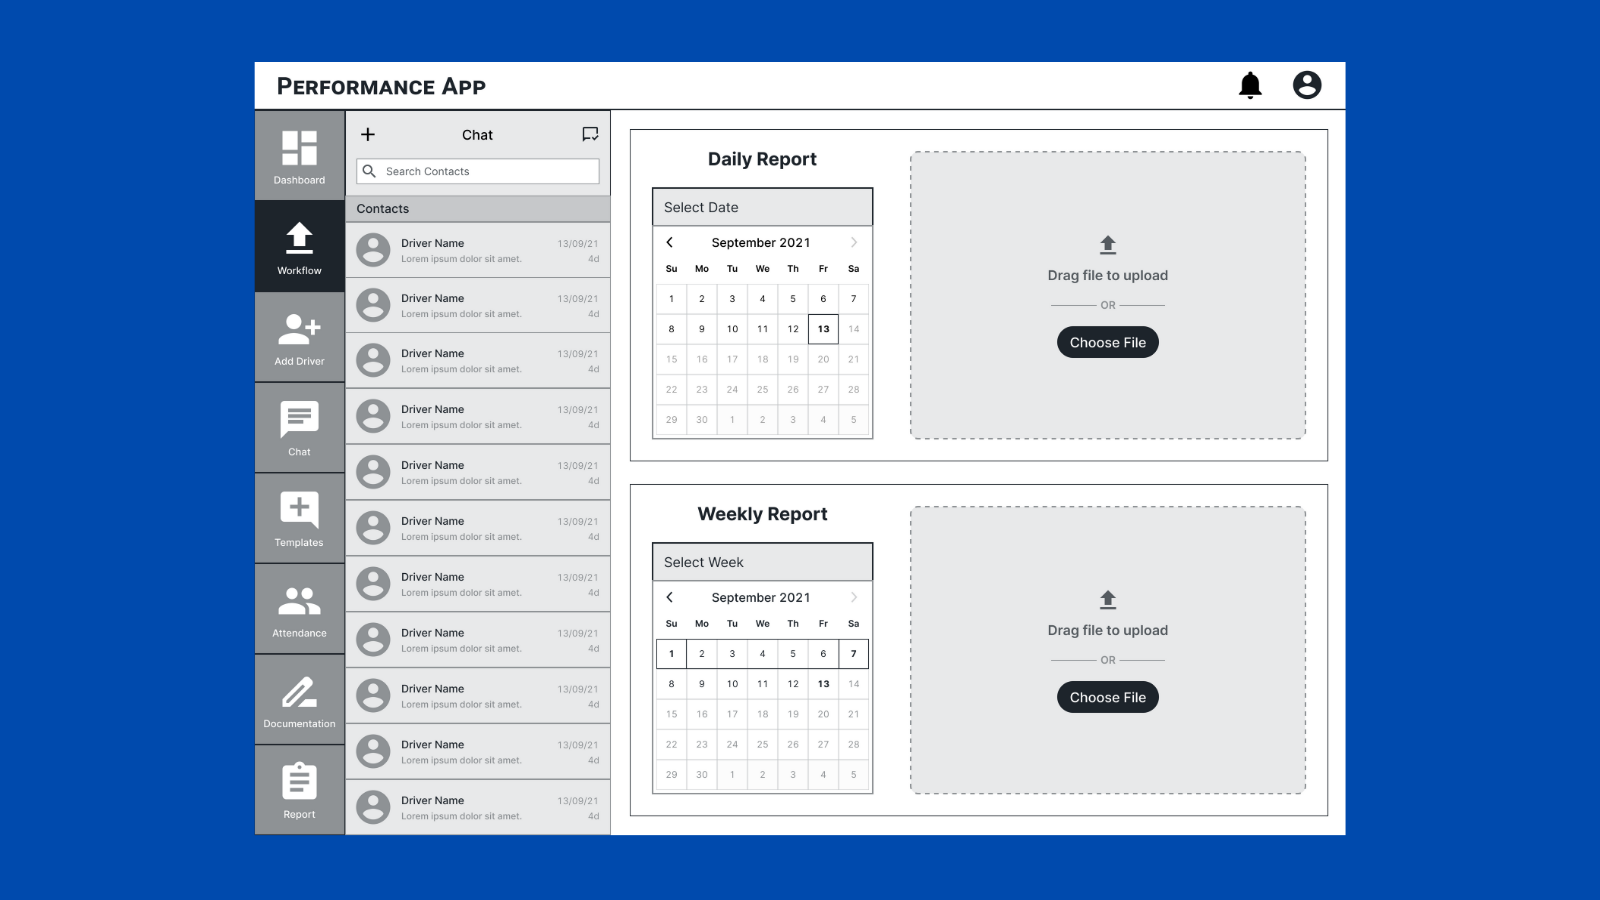
WORKFLOW
The Workflow page is responsible for uploading daily and weekly reports for the deliveries and the driver performances.
Initially, we wanted the chat to be present on every tab/page for easy access. After a few weeks, we realized that this would be distracting and take away unnecessary space from other screens/pages.
I started with medium fidelity designs and split the screen into 2 sections, one for uploading daily reports and the other for weekly reports.
After meeting with the developers, we decided to change the split into two separate screens to carry out the uploads.
Once the reports (in PDF form) are uploaded, they are saved into the Report tab of the application.
The weekly reports span from sunday to monday. If the week is not yet complete, the previous week will automatically get selected.
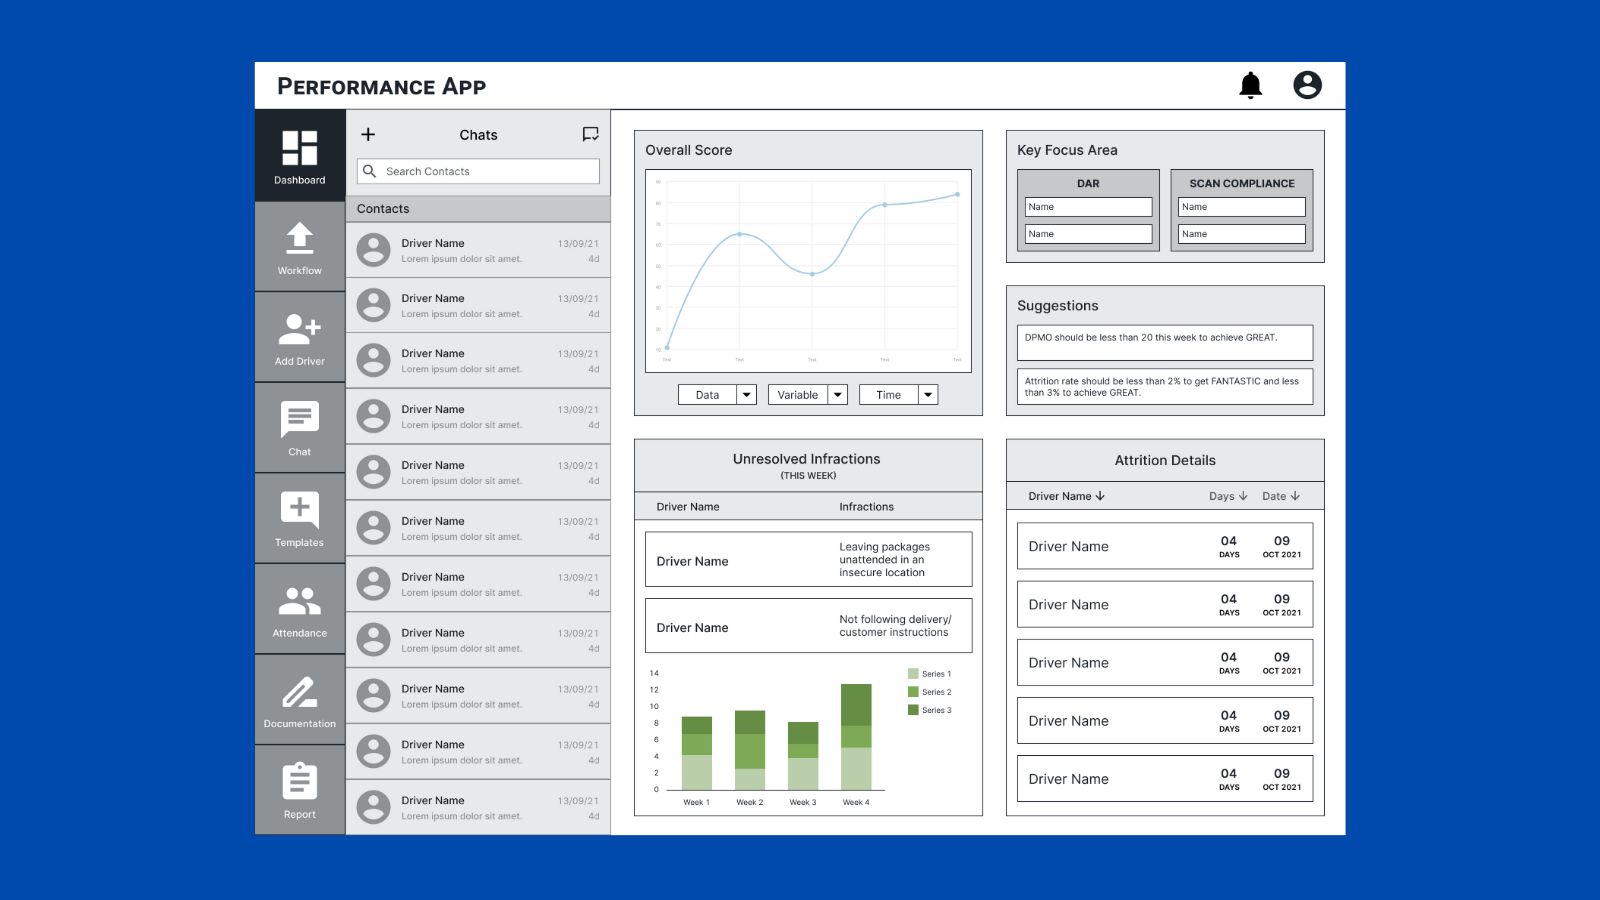
CHAT + DRIVER DASHBOARD
The Chat tab can be used by the DSPs to contact the drivers and to send their reports to them.
Instead of having an entirely new tab for accessing each driver's performance report, I added the reports to the right panel in each chat window.
The DSPs can check a driver's performance while talking to them and quickly send them particular areas of improvements with just one click.
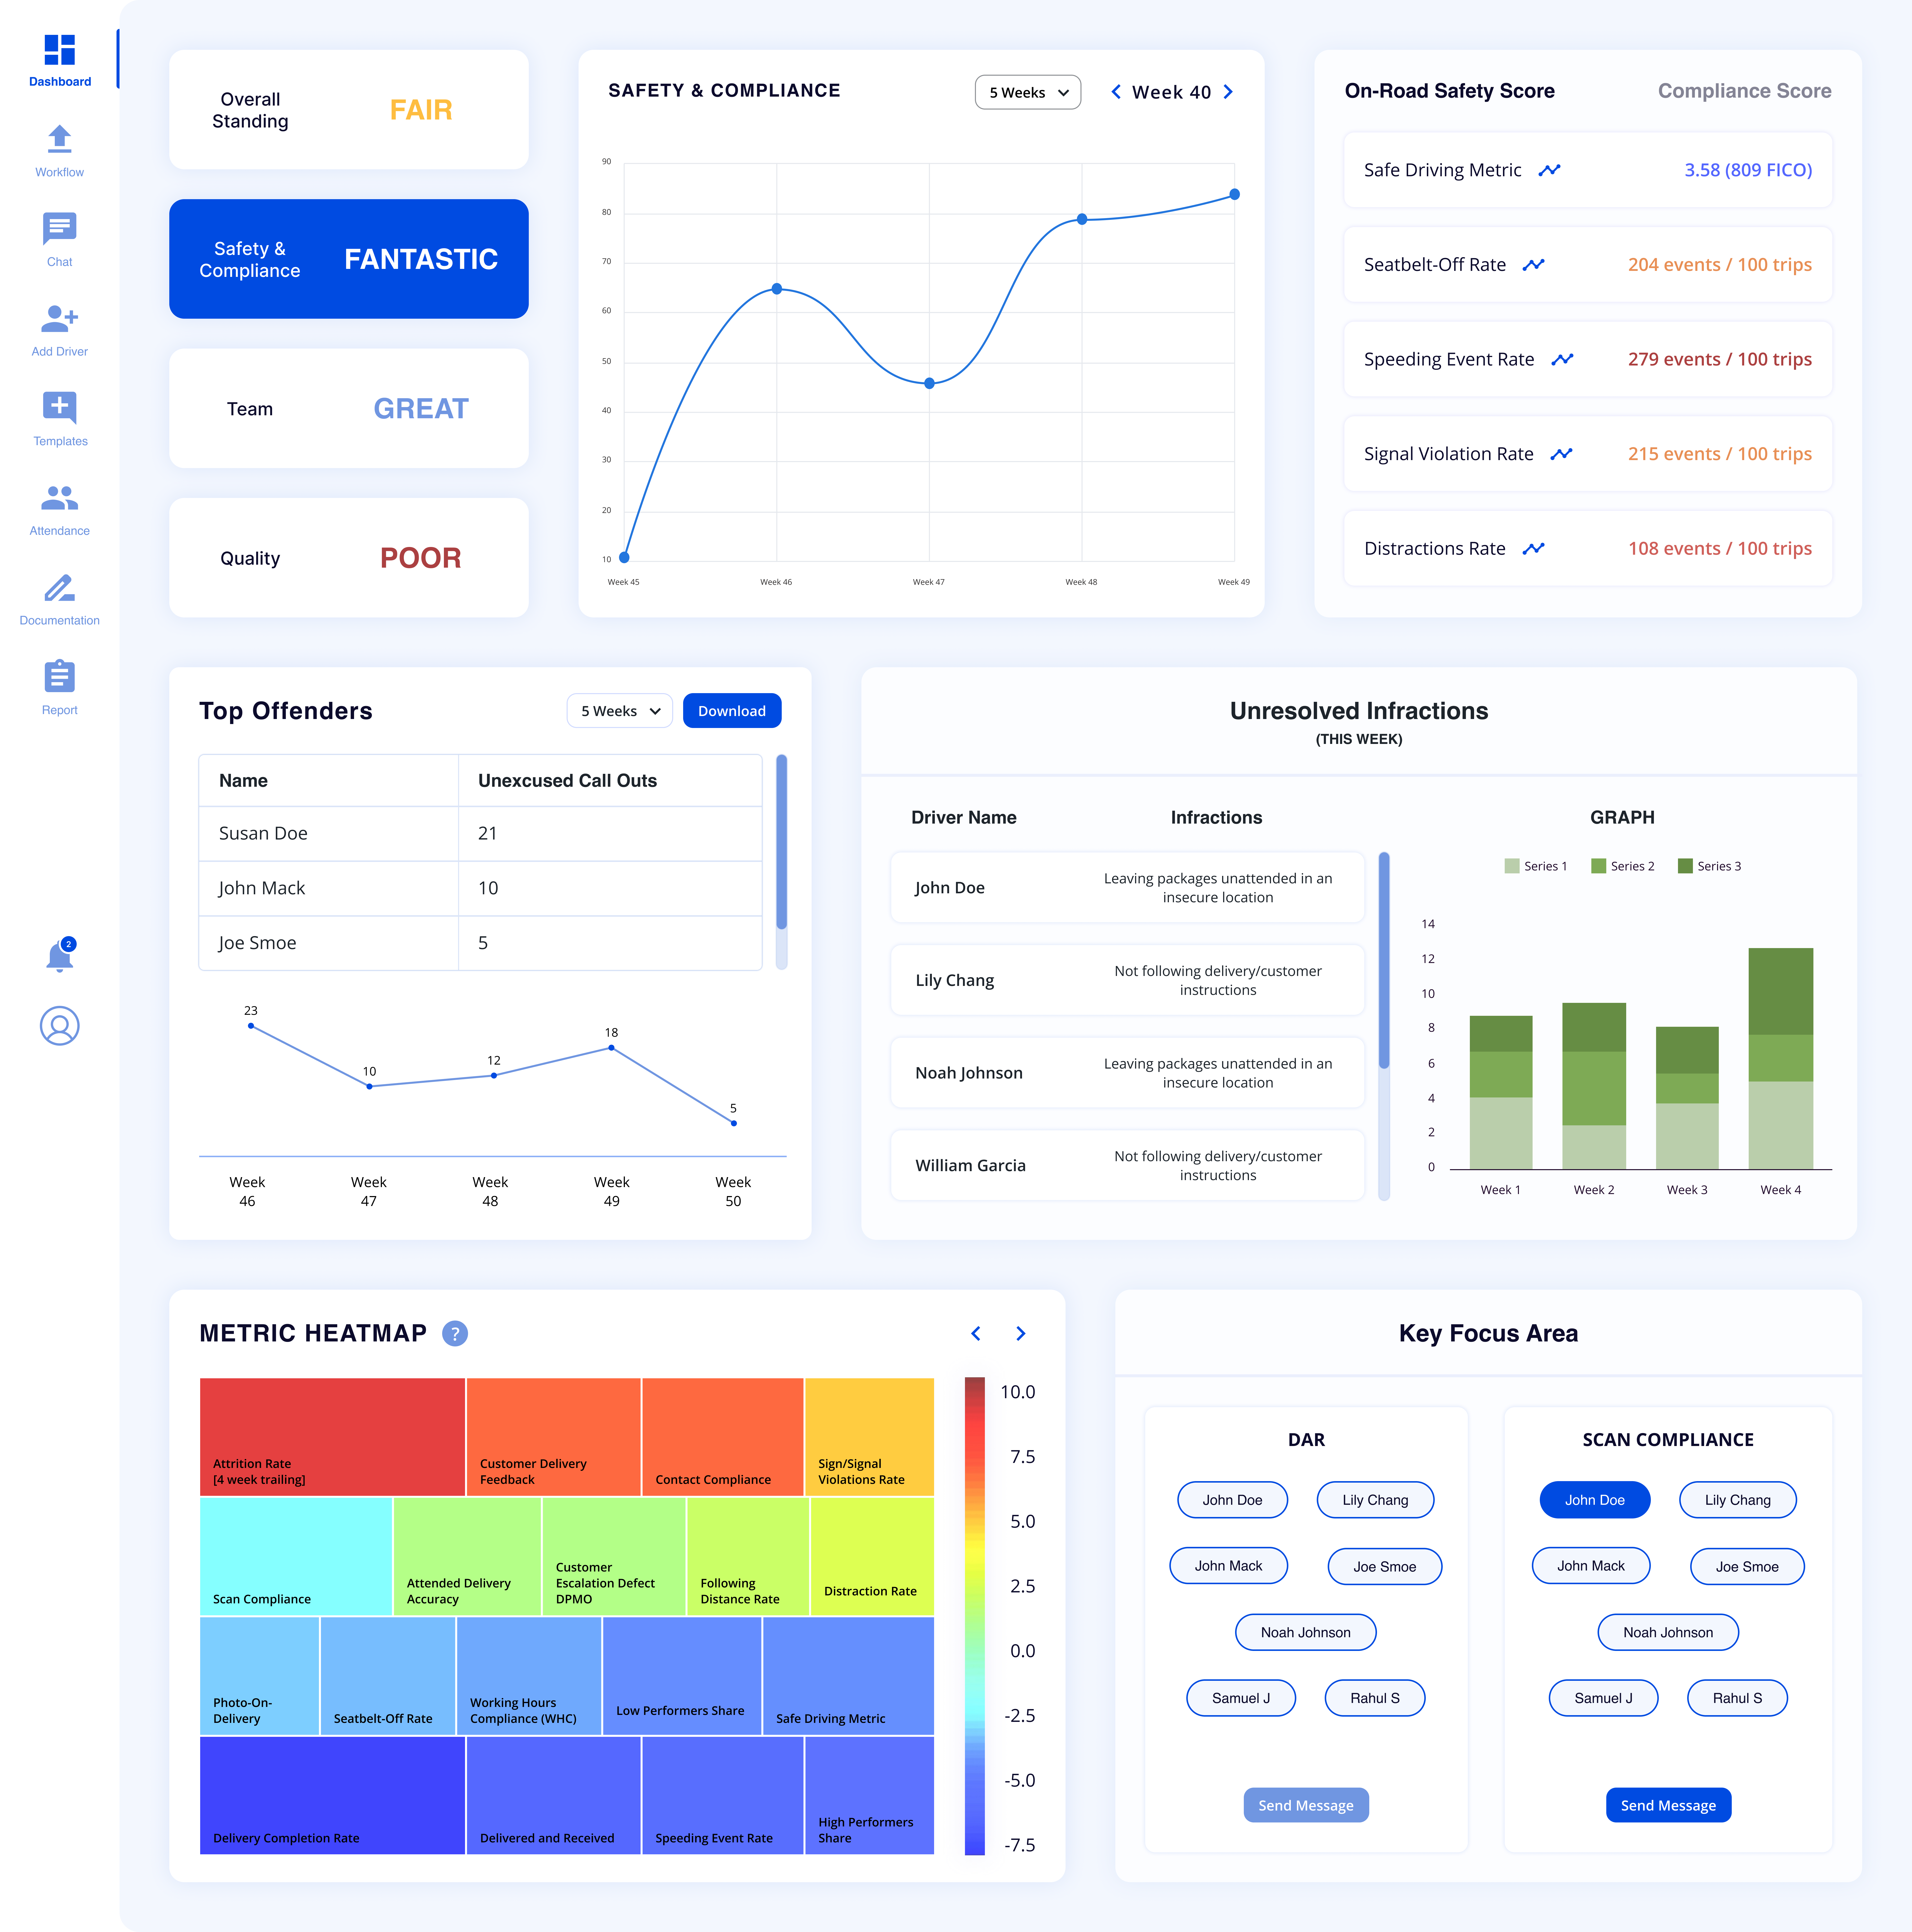
DASHBOARD
For the dashboard, I was provided with an example of the report and was asked to design the dashboard based on it.
So, for this part of the project I had to visualize data in a way that would be comprehensible and relevant to the DSPs.
Here is one part of the report example I used:
I started with a low fidelity design to visualize each section of the report.
Then I created the medium fidelity designs to visualize how the data would look.
This was the exact moment where we decided to keep the chats in a separate tab as the dashboard started to look cluttered and overwhelming.
Next, I designed the high fidelity prototypes and we would discuss these iterations every few days to reach a final protoype that is easy-to-follow for the DSPs and feasible to develop for the development team.
Since I have a background in Computer Science Engineering, I made sure all the designs I was creating were realizable.
Iteration 1:
The first protoype was mostly based on the medium fidelity design. I utilized drop-downs to fit the data on a static dashboard screen.
However, after discussing with the clients, we realized this design will hide a lot of important information and we should not expect our users to use these many navigations.
Iteration 2:
I decided to expand the dashboard screen vertically. By making the left navigation bar static and keeping the dashboard content scrollable I was able to include a lot of important information and avoid too many button clicks.
I was also asked to build a heatmap into the dashboard. This was the initial idea that was pitched to me by the development team.
One major challenge I faced was to make complete use of the available screen space. So, I made some decisions to place each section at an appropriate location based on their usefulness to the DSPs.
Iteration 3:
I did not feel the first heatmap was communicating any information so I decided to expand its contents.
But this was more aesthically pleasing than useful. The colors communicated vague information, not the actual metrics.
Final Prototype
After some more discussions with my team, we moved the heatmap down as it was low on the priority list for the DSPs. However, I did a redesign of the heatmap and included the metric scale to make it easier to understand.
I added download buttons to some sections so the DSPs can get the most useful parts of the reports.
The Key Focus Area section was not actionable so I added a send message button so the DSPs can contact the drivers collectively and without having to go to a different tab.
Takeaways
During this Internship, I got the chance to work with different teams within a company (clients, design team, development team). I learned a lot through regular meetings and the freedom I was given to explore new ideas and design choices. I learned to visualize data in a way that is most useful and comprehensible for the users.